In our last blog article about attribution models and the user journey, we discussed the different types of attribution models and their main characteristics.
We also dipped our toes on the shore of the user journey sea, and discovered that more complex products (or more expensive ones) tend to have a more complex and convoluted user journey.
Today I am back to unmask the secrets (or at least try to) of attribution model comparison, with some data from our very own clients for 2016. Here’s a look at how major attribution models differ, and which attribution model might be right for your hotel.
Some Background
In the past year, we’ve seen the rise of mobile as the main source of traffic for many of our clients.
However, conversions on mobile tend to lag a bit, as people are still reticent to input their credit card details on their mobile devices. This is something that could potentially be tackled with a cross device conversion approach.
But what happens when the user’s first interactions happen on mobile via a Display ad, or a paid search ad, and then the user moves to desktop and enters the website directly immediately before converting?
In this scenario, and under the assumption that Last Click Attribution model is in place, the conversion will be 100% attributed to Direct. In reality, though, there were other channels and possibly other devices involved in the process of convincing the user to make a purchase.
Even without considering Cross Device attribution, which is one of the most complex topics in the industry, there’s a way you as a hotel marketer can learn more about which channels drive the most amount of conversions to your website.
Let’s take a look:
Last Click vs First Click
The best way of illustrating the differences and the influence of each channel in conversions is to compare the results for Last Click attribution with First Click attribution. Remember, a Last Click attribution model gives all the credit for the booking to the last (online) interaction with your hotel a user has before booking. A First Click attribution model gives the credit to the first interaction.
As we mentioned in the last piece on attribution, Last Click models tend to over-represent the importance of Direct traffic, as this is the last interaction in many cases (especially when there’s a cross device conversion).
Simply put, direct traffic conversions appear more prevalent when you’re using a last click attribution model.
Looking at data for all of Netaffinity’s CMS clients over Q4 2016, you can clearly see this pattern across all devices:
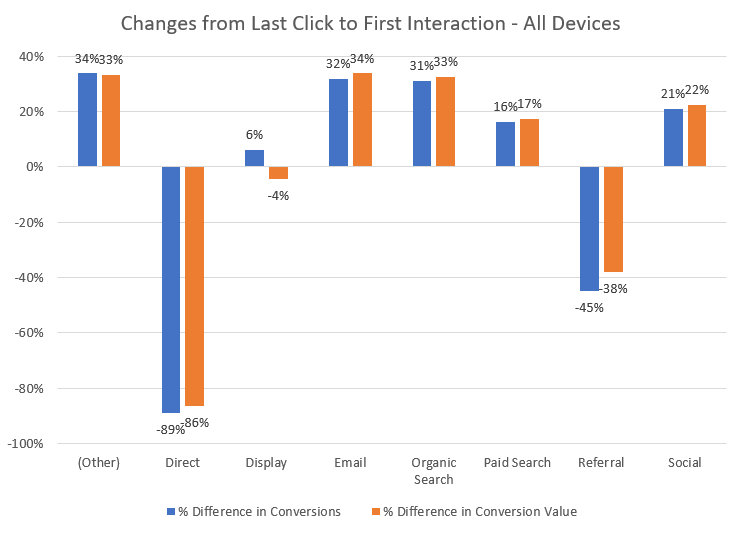
Figure 1- Difference in Number of Conversions and Conversion Value when moving from Last Click attribution to First Interaction
As the graph illustrates, when moving from a Last Click attribution model to a First Click attribution model, Direct traffic suffers a sharp decline both in number of conversions attributed, and the value of conversions as well.
Another channel that doesn’t benefit from the change in Attribution models is Referral, which loses 45% of conversions and up to 38% of conversion value.
The drop in Direct and Referral is then offset by the increase in conversions and revenue on all other channels.
This provides an interesting insight into which channels are influencing consideration at early stages of the user journey.
Organic and Paid Search are very important channels, as is Social, in driving users towards the first steps of the funnel.
These channels increase awareness and consideration in these first interactions with your brand. Therefore, they drive bookings and posterior conversions.
Comparing Last Click to First Interaction results puts all your marketing activity into perspective. It shows how important it is to maintain a good level of paid activity across the board (both in social and search), while at the same time maintaining good SEO practices to drive Organic traffic and keeping a good email marketing practice.
In all likelihood, you as a hotelier are already taking measures to contact users at different stages in their user journey.
You’ll be creating and sending E-zines, working with your Digital Marketing specialist around your paid campaigns, and increasing your Social presence on Facebook and other Social Media platforms.
The important thing is that the graph above shows – to a certain extent – the actual impact of all these channels in your bottom line: namely, E-commerce conversions.
Not convinced? Let’s look closer.
Here are the changes undergone by 3 channels when hotels move their attribution models from Last Click to First Interaction:
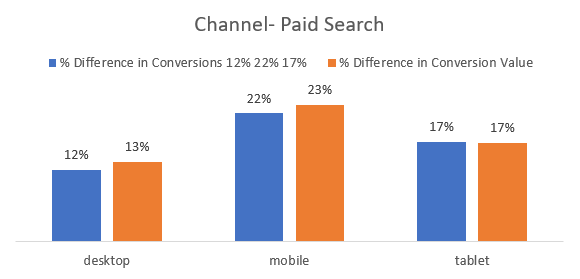
Figure 2: changes in conversions and revenue for Paid Search by device.
Notice how Mobile has the highest average change here. This means that a significant amount of overall conversions were generated in user journeys whose first interaction was a paid search ad on a Mobile device.
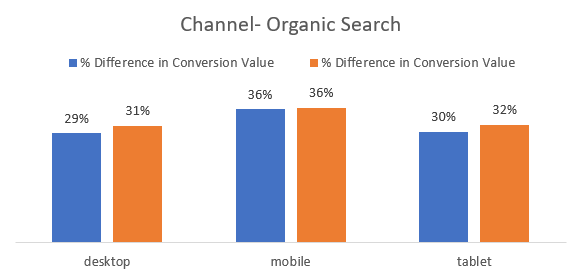
Figure 3: changes in conversions and Revenue for Organic Search.
Note here as well the higher increase for Mobile. This means organic results on mobile are also highly important as first interactions.
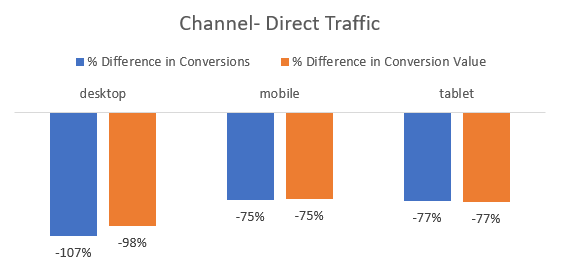
Figure 4: changes in Direct conversions moving from Last Click to First interaction.
As you can see in the graphs above, mobile traffic brings a significantly higher amount of conversions and revenue if we move to a first interaction model.
This supports the idea that there are many cross-device conversions happening.
Users may start their conversion journey on their mobile device, and then, once they’ve made up their minds and investigated a bit more, they move to their desktops and finish their conversions there.
Notice that the direct traffic decrease is almost 25% higher for Desktop than it is for Mobile and Tablet.
Assisted Conversions
A final note should be made on the concept of Assisted Conversions. Assisted conversions are all those interactions that the user has with your website or brand in their user journey, leading up to a conversion.
Let’s consider, for example, an AdWords campaign that brought your hotel €1000 in revenue. At a cost of €100, you get a CPA of 10% for that campaign.
These conversions are purely Last Click conversions. Therefore, this model is not considering that that same paid campaign brought in some users on mobile, who ended up moving to their desktops and booking a room there, bringing you an additional €600.
In that case, there was €600 in revenue generated by Assisted Conversions. The cost of generating that traffic was already computed on the formula for CPA (CPA=[Cost/Revenue]*100), but the additional revenue was not. When considering the additional revenue, we obtain an Assisted CPA of 6.25%.
Assisted conversions are a good way of gauging how much of your conversion activity is influenced by different channels. It is especially useful when evaluating performance for Paid campaigns, particularly prospecting campaigns – as these tend to be the first interaction of users with your brand.
Conclusion
After examining the different attribution models, you should be able to tell how your users behave across different devices. You should also be able to see which channels are bringing in more conversions on which devices, and how many of those conversions seem to be cross-device conversions.
Understanding that your user journey is complex, and that each channel has its pros and cons to exert influence on the different stages of that journey. It is very important to keep your activity across different channels relevant and fresh.


