According to some, the world’s most valuable resource is no longer oil, it’s data! And for an online businesses such as a hotel there is so much available data and analytics platforms it can be overwhelming. However one free resource that has an incredible amount of valuable data is Google Analytics. So in today’s article we’re going to show you how to find, and understand, some of the more important reports available for your e-commerce hotel site.
So let’s get stuck in.
1. Traffic Channels
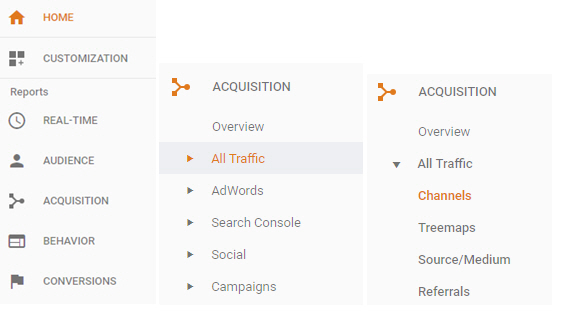
One of the most basic, but important reports, is your traffic report. This can be found under Acquisition. Then All Traffic and then Channels.
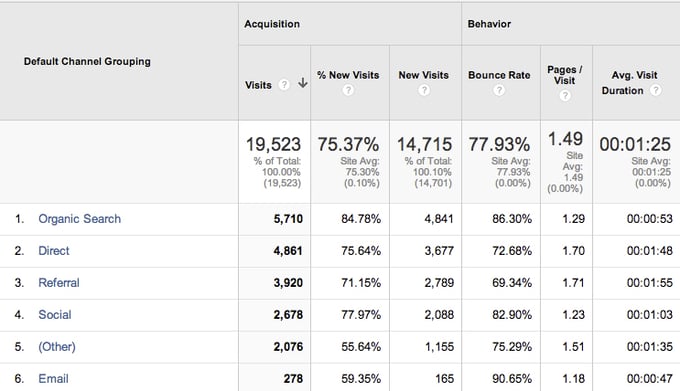
You will then see a page like this.
It’s a snapshot of what channels are bringing you the most traffic and if any particular areas need some attention. For this example email traffic is particularly low here so you would need to look at your email marketing strategy and make some changes.
Perhaps your subject lines are weak or your database is too small? Whatever the case this data allows you to see what marketing activity is actually working. Now let’s take a closer look at some of the channels that are more relevant.
2. Organic Search
SEO is a fundamental part of any modern marketing strategy and it’s easy to see why. The number of daily searches on Google is 3.5 billion, which equates to 1.2 trillion searches per year worldwide!
That’s why you should deep dive into your organic search results. Just click on “Organic Search” and you’ll see something like the image below. This will tell you what keywords are driving the most traffic and others that are under-performing. You can then use that knowledge to shape your SEO strategy moving forward..jpg?width=608&name=4%20(1).jpg) 3. Direct Traffic
3. Direct Traffic
We’d recommend having a look at your direct traffic stats in detail as this tells you about your general brand awareness. The majority of direct traffic comes from someone typing in your url directly as they are familiar with your brand. This can indicate the health of you overall marketing strategy and if you see an increase in same following a branding campaign this can act as a metric for success.
4. Behaviour Flow
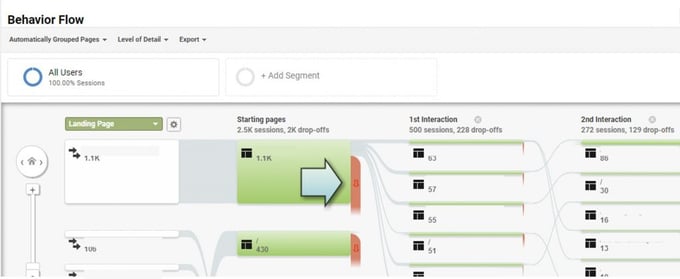
This report is great for understanding what a user does once they enter your website. It follows a user from the moment they land on your website to the moment they make a purchase. It can also show you which factors contributed to someone leaving your site without reaching that conversion goal.
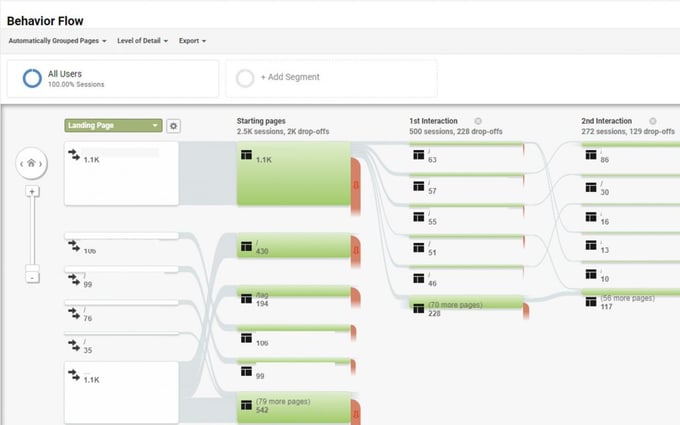
To access this report click on Behavior, Behavior Flow and you’ll be served a report like this.
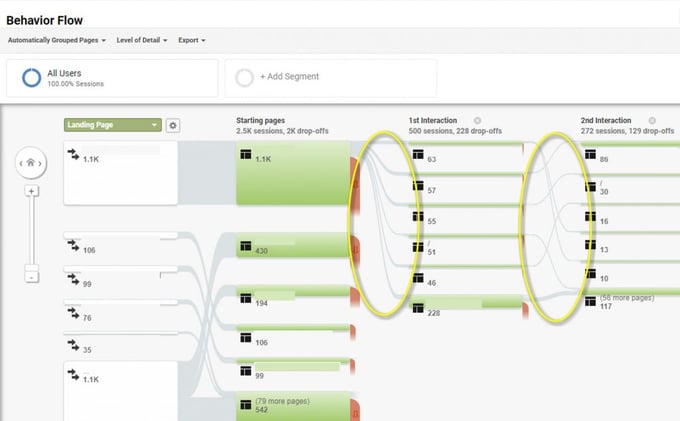
You read the report left to right so start with the landing pages. These show you the page your web visitors have landed in on. From there you can follow their journey to their 1st interaction (next page clicked on), 2nd interaction (page clicked on after that) and so forth. The greylines highlighted below show you the exact path the visitors are taking.
Also please look at your drop off rate here too. Hover your cursor over the red section to see the percentage of overall traffic dropping off from that page. Pages with particularly high drop off rates may indicate issues that are stopping lookers from becoming bookers. On a hotel site this may come down to poor imagery, a call to action (CTA) button that is not visible or a poor mobile experience.
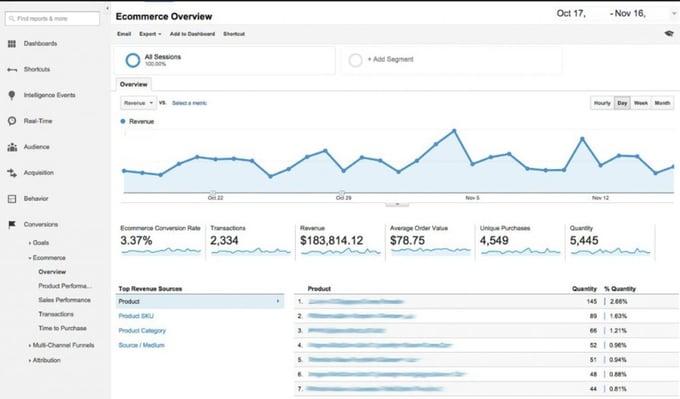
This is a fantastic overview report that gives you lots of essential information at a glance. Access it through Conversions/Ecommerce/Overview.
To start with, you have your E-Commerce conversion rate; this is your number of transactions divided by your number of website visits x 100. This is essentially the percentage of visitors that ultimately ending up booking a room or making a purchase.
You also have your transactions within that time period, revenue, average order value and more. These are key indicators into how well your website is performing and should be looked at regularly. You can also use the calendar to compare to the previous time period or against the previous year to see how the site is performing comparatively.
CONCLUSION
There’s a wealth of analytics tools on the market however Google Analytics is totally free and has some of the best data available for you website. Invest some time in learning about the tools and reports and it will help you understand your customer better and improve your long term strategy to grow profitability.


