As digital marketing gets more sophisticated, the topic of attribution models has come up over and over in conversations with clients: every hotel wants to know what, where and how their guests are booking online. When you fully understand your online conversions, you can make better decisions when doing something as complex as allocating budgets, or as simple as going through a report.
Attribution is one of the trickiest aspects of the industry: in a world where each and every user is interacting with your brand through a multitude of channels, it becomes very difficult to properly assign the correct value to each channel.
So, most of the time, we end up using the simplest attribution model available in order to at least have something to base our conclusions on.
In this article, I aim to clarify some of the concepts behind successful attribution models, while discussing my own encounters with the beast that is attribution modelling.
What is an attribution model?

I’ve been talking about attribution models without properly introducing them… What exactly is an attribution model?
An attribution model is a set of rules that determines how the credit for a conversion is assigned to a touchpoint on a conversion path.
A touchpoint is a point of contact or interaction in the user journey. For example, Paid Search becomes a touchpoint when the user clicks on one of your ads.
The most widespread attribution model is the Last Click model. This model attributes 100% of conversions to the last interaction to occur before the conversion. It is the simplest model available, and gives somewhat accurate results.
On the down side, it doesn’t consider the effect of assisted conversions, and it oversimplifies the user journey by giving importance only to the last interaction.
Here’s an example of an assisted conversion: a user has perhaps seen your listing on Trivago, visited your site once or twice, compared prices on different channels, and a few days later clicked on one of your remarketing ads to finally make a booking.
Which stage of that interaction was the most important? In a last click model, only the remarketing ad counts.
On the opposite side of the spectrum, the First Interaction attribution model gives 100% of the credit for conversions to the first interaction the user had.
In contrast with the last click model, First Interaction only considers the channel that brought the user into the funnel in the first place. Therefore, any other interactions that might also have assisted in the conversion don’t get any sort of credit.
In the middle of these two extremes, there are other models that attempt to provide some transparency to the whole deal:
- Linear: each step of the funnel gets attributed with an equal portion of the conversions. If there’s 5 steps in the user journey, each step gets 20% of the conversions, and so on.
- Time Decay: a percentage value is assigned to each of the steps in the user journey, based on the closeness of each to the conversion moment.
- Position Based: in this model, 40% of conversions are attributed each to the first and last interactions, with the remaining 20% being distributed throughout the remaining touchpoints
- Last Non-Direct click: ignores direct traffic 100% and credits the sale to the last channel clicked by the customer
- Last Adwords click: credits the last paid click through Adwords. Paid Search would here be taking all the credit in the instances in which paid search was involved.
- Personalized: attribution models can be customized and personalized based on the specific needs for each account. However, this is a very complex process, as it requires in depth understanding of the business, the user journey and each of the channels. Any tracking issues that might exist in the account will pollute the data and might end up having a major impact in how the conversions are attributed.
Understanding the user journey is not the purpose of an attribution model, because the attribution model only attributes conversion based on a set of rules. Instead, the attribution model should reflect the reality of the user journey to a certain extent.
Multi-Channel Attribution and the User Journey Rabbit Hole
When thinking about user journey, many people only think about what the user does after they reach your website. Where are they clicking? Which pages have the highest dropoff rate, where are our users bouncing, and which pages have the best conversion rates? All of this is a crucial part of the user journey. However, this is also one of the last stages of it.
Think of the user journey as a quest. For example, a quest to find the perfect hotel for your family’s horse riding holiday.
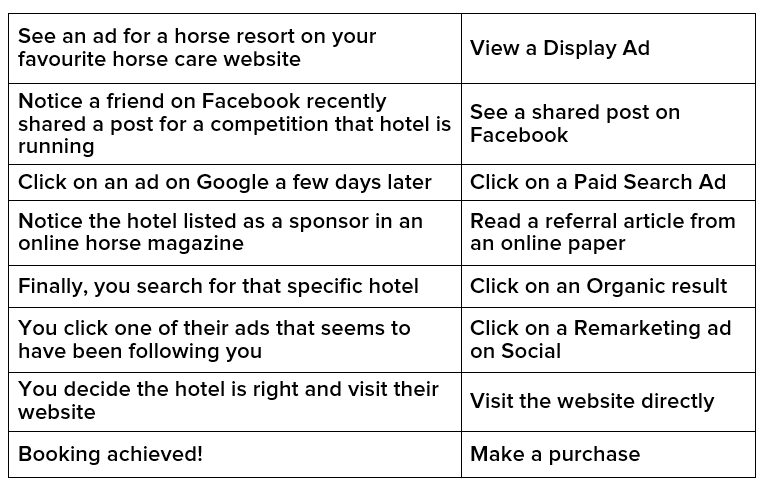
Let’s make a short list enumerating just a few of activities you might undertake in your booking journey:
- See an ad for a horse resort on your favourite horse care website
- Notice a friend on Facebook recently shared a post for a competition that hotel is running (possibly for a horse-related prize)
- Click on an ad on Google a few days later as you research hotels’ riding facilities
- Notice the hotel listed as a sponsor in an online horse magazine you skim regularly
- Finally, you search for that specific hotel, and visit their website
- You haven’t booked yet, but you click one of their ads that seems to have been following you from site to site over the past few days
- After talking it over and looking at alternatives, you decide the hotel is right and visit their website to make a booking
- Booking achieved!
Each step of that journey provided you with something you needed to fulfill your ultimate objective.
Your user journey may have a similar structure.
Let’s look at them in comparison:
In fact, the complexity and survival rate can feel a bit like Game of Thrones. As happens so often in Game of Thrones, anyone can “drop off” from the funnel at any minute…
User journeys can be extremely complex. It can feel like a desperate quest to survive the time and cognitive distance required to get from “I want a vacation” to “I’m ready to book.”
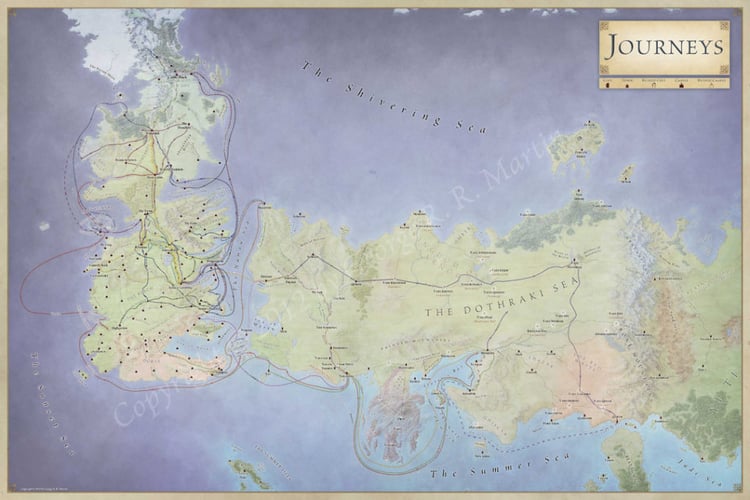
Hopefully your user journeys aren’t this complicated!
So it’s important to try to understand the nuances involved, and how to interpret them.
As you could probably tell by looking at the above table, each of the steps in the process involves a different channel. Let’s see what it looks like broken down by channel:
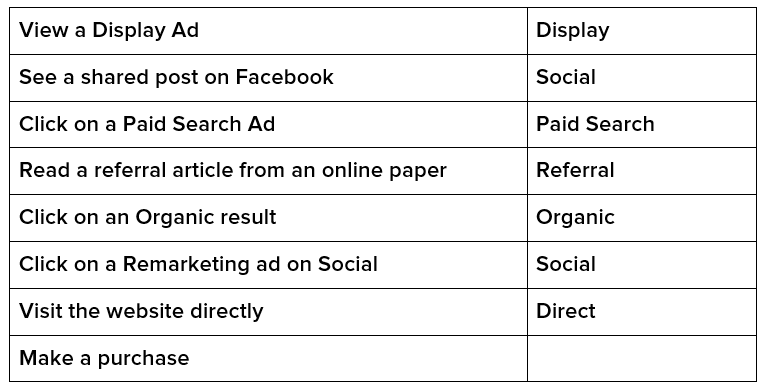
When this is the structure of the user journey and the account has last click as the attribution model in place, Direct traffic takes the whole credit for the conversion. However, a glance at that user journey should be enough to conclude that Direct wasn’t doing all the legwork.
As a general rule, the more complex the product (or more expensive), the more convoluted the user journey.
Discovering Your Hotel’s User Journey
At this point, you might be asking yourself how to find out which channels were involved in your user journey. Also, after that, how do you find out how long the user journey is?
That’s were analytics comes in. In your Google Analytics account, you have much of the information you need to find this out.
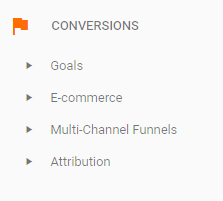
On the left hand side of Analytics, you will see the above menu. To explore the Multi Channel Funnels, just click that option.
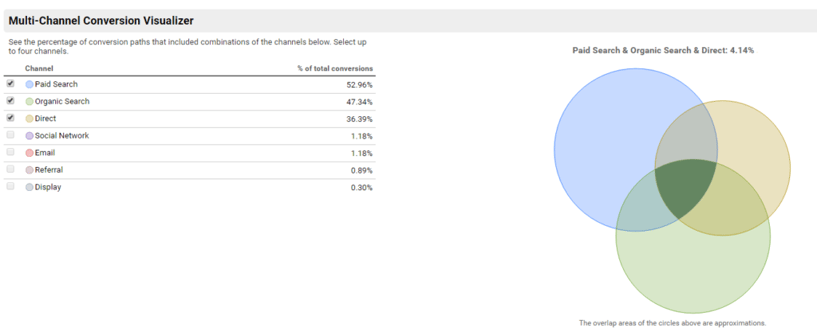
On the Overview section, Analytics shows a series of options that allows us to see how many conversions involved more than one channel. (Please keep in mind that this view still takes into consideration whatever attribution model is valid for the whole account. So if your attribution model is Last Click, you need to keep this in mind, as there might be a over-representation of Direct conversions in the mix)
I’m a firm believer that you can explain almost anything using Venn diagrams. In this section, Analytics shows a set of Venn diagrams that show the extent of the channel overlap in conversions:
Another particularly useful section within the Conversion menu in Analytics is the Path Length report.
This report tells you how many interactions with the different channels users had before converting. It also assigns the value generated by those conversions to the different path lengths.
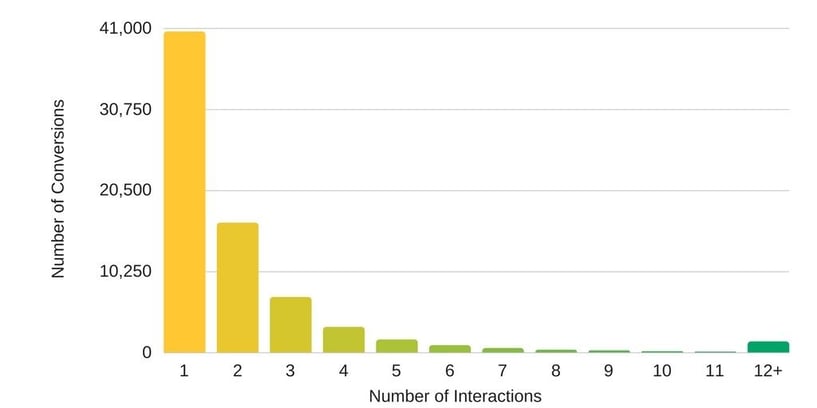
Similar data can be obtained on the Time Lag view of this section in Analytics. Time Lag shows number of days between the interaction and the conversion.
The relationship is very similar to the above graph, which makes complete sense. Consider the fact that more interactions require a higher level of involvement, and therefore more days.
Finally, the Top Conversion Paths report shows the most common channel combinations that brought a conversion to your hotel website.
Note that these don’t include single-interaction conversions. These will be attributed directly to the channel, not to a conversion path.
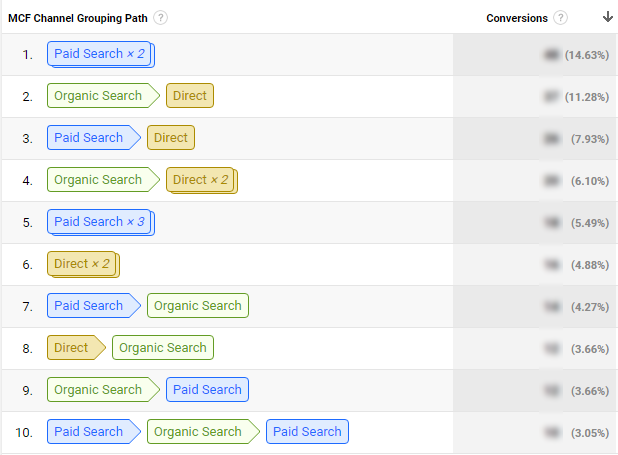
Here, Paid Search x2 was the top conversion path for December 2016. This means that these conversions happened after the users clicked on two separate paid search results.
Organic + Direct was the second most popular path. This means that these conversions happened after the users conducted one organic search and clicked on one organic result, and then accessed the site directly before converting.
Top conversion paths are a good way of gauging if your strategy for channel management works for your product. They are also a good way of learning which odigital activities might need a few tweaks to prevent users from dropping off the funnel.
Conclusion
Attribution modelling and multi-channel attribution are among the most complex topics in digital. This is especially true for hotels, who sell a pricey product and are usually present on many different online channels.
It takes a lot of work and time to approach the subject and come out with a solid solution.
However, the benefits far outweigh the costs. Understanding attribution opens a window to your customers’ worldviews. The more you understand them, the better you can serve them. You can adapt your digital strategy to cater to their behaviour.
I’ll be publishing a short series on attribution models for a comprehensive look at what you need to know. In the following articles, I’ll be discussing attribution model comparison in more depth. We might even peer into the murky waters of Cross Device attribution… stay tuned!


