As a hotelier you might see your guests at check-in, dining in your hotel restaurant, or using your hotel’s leisure facilities, but do you know who your guests really are?
Do you know who your website content should be targeting, who’s visiting your site and who’s actually parting with their cash to make the booking? If you can’t answer those questions, it’s time to start building a picture of your target market in order to better meet their requirements and wishes.
You can do this by tailoring your rate plans and packages to suit various guest types. You can also use data segmentation to send and display the right content to the right people. Be it for email marketing campaigns, or display and remarketing ads.
Whilst you should be looking at your own guests in careful segments on a property level, it’s helpful to take a look at the industry at large. This data can tell you who you should be trying to talk to and on which platform and devices.
Across our portfolio of clients with 12,800,000 hotel website sessions for the first half of this year, we have monitored each transaction to find out those answers. Of course, this data is purely for guests who made their booking online, so keep in mind that there are guests who book over the phone, or in some cases in person, who are not represented in these figures.
Let’s take a look at the demographic of people who have visited our client sites and those who booked, from Q1 and Q2 2017:
Who Visits
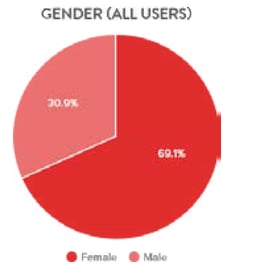
Women made up the majority of visitors. The ratio of female to male users is more than 2:1, at 69% female and 31% male. This may reflect that more women are doing research, or that women simply prefer to visit more sites during their research.
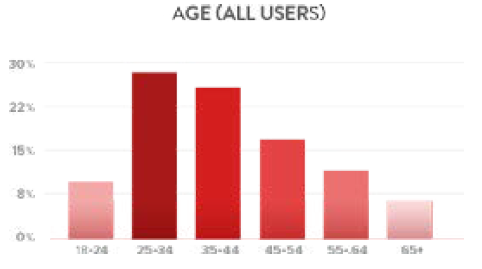
The young adults are the most enthusiastic travelers. 56% of visitors to hotel websites are 25-44, and the strongest demographic is 25-24 (28.8% of users).
Who Books
While more women book than men overall, this number is skewed by the higher number of women visiting sites. On the whole, men convert 1.5 times more often than women, although they contribute less revenue and transactions overall.
As far as the age of your guests is concerned, the same pattern as above holds true for transactions and revenue as well. Those aged 25-44 make up about 55% of transactions and revenue.
However, it’s worth noting that those aged 45-54 and those over 65 convert more often. This suggests that by the time your more mature guests reach the website, they are more ready to book. Younger ones, most dramatically those age 18-24, tend to shop around a bit more before committing to a booking.
5 Ways To Implement Guest Data Into Your Strategy
- Ask your guests for information at checkout: name, email address, age, gender, occupation.
- Train your front desk in collecting data for each guest. Such as what the purpose of their trip is etc.
- Tailor your packages for each of your top segments. This could mean using value ads such as a free drink on arrival, or by using local events to make your hotel standout to those attending them.
- Segment your data for marketing purposes. For example, send your Valentine’s Day campaign to males, with a special offer to save them money and hassle.
- Make sure your data storage processes and systems are GDPR compliant. A new regulation coming into force in May 2018 has significantly tightened up laws around storing and using data, so make sure you’re clued up on it.
For more interesting insights from our client data, check out our Digital Trends Report.


